
Data quality dimensions describe different ways data can meet or fail a requirement. Six commonly used dimensions are accuracy, completeness, consistency, timeliness, validity, and uniqueness. Some frameworks also identify integrity or other dimensions separately. There is no single score that makes every dataset fit for every use.
Choose the dimensions that matter for the decision, define the measured population, and document what a passing result means. A field can be complete and valid while still being inaccurate.
Use explicit populations and formulas
The formulas below are illustrative measurement definitions. Teams should document exclusions and the treatment of nulls, duplicates, and unavailable reference evidence before comparing scores.
| Dimension | Example measure | Example failure |
|---|---|---|
| Completeness | Required values present divided by required values expected, times 100 | 4 of 100 required customer IDs are missing |
| Validity | Values meeting the declared format or domain divided by values evaluated, times 100 | A country code is outside the approved list |
| Uniqueness | Distinct non-null business keys divided by non-null key-bearing rows, times 100 | An order key occurs twice |
| Consistency | Evaluated comparisons that agree under the defined mapping divided by comparisons evaluated, times 100 | The same customer has conflicting approved categories |
| Timeliness | Deliveries meeting the defined deadline divided by deliveries expected, times 100 | Yesterday's close arrives after the reporting cutoff |
| Accuracy | Verified values matching an authoritative reference divided by values verified, times 100 | A validly formatted address is not the customer's address |
Different tools can calculate similarly named metrics differently. Record the formula rather than relying only on the label.
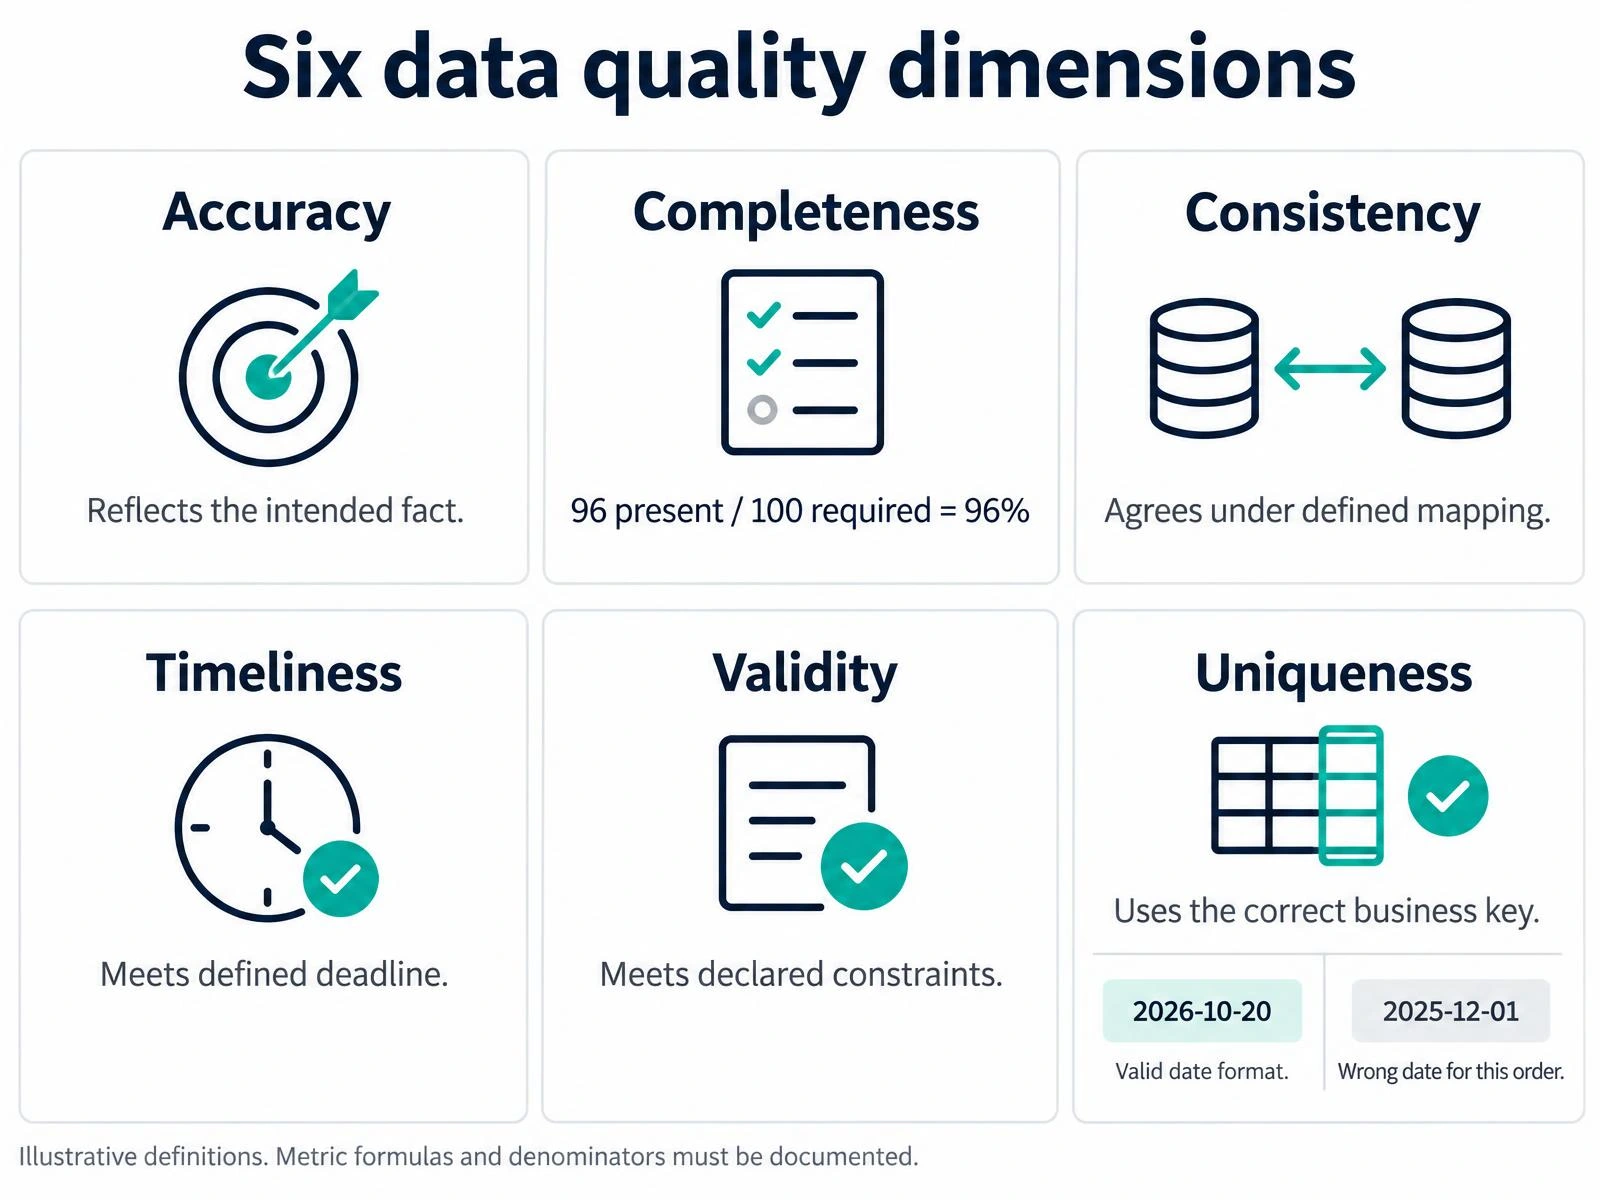
Define the measurement population and formula before interpreting a quality score.
Completeness needs a business condition
Suppose 100 completed orders require a customer_id and four values are missing. Completeness is 96 divided by 100, or 96 percent. If draft orders do not yet require a customer_id, exclude them through an explicit status condition rather than treating them as unexplained failures.
Distinguish a missing field from a missing record. A table can have customer_id populated on every existing row while an entire set of expected orders is absent. Detect that through population or source to target checks.
Validity is different from accuracy
The date 2026-10-20 may satisfy a date format and a permitted range. It can still be the wrong delivery date for a particular order. Validity checks the declared constraint. Accuracy requires evidence about the underlying fact.
Use an authoritative record or an approved verification process for accuracy. If only a sample was verified, report that sample and its scope. Do not present a sample accuracy rate as a verified result for the entire estate.
Define uniqueness at the right grain
An order table may require one row per order_id. An order-line table normally permits repeated order_id values because each order can have several lines. The relevant key may be order_id plus line_id.
Under the illustrative formula above, 99 distinct keys across 100 non-null key-bearing rows produce 99 percent uniqueness. A metric counting rows whose key occurs exactly once can produce a different result. Neither should be interpreted without its definition. Measure null-key completeness separately.
Keep consistency and integrity specific
Two systems may represent the same country as US and United States. A direct string comparison would fail, while a documented mapping could show agreement. Test the approved mapping rather than forcing every system to store identical text.
Referential integrity asks whether a relationship is valid, such as whether an order's customer_id exists in the customer reference population. A reference match does not establish that the customer was correctly assigned to the order. That remains a separate requirement.
Turn dimensions into explicit control specifications
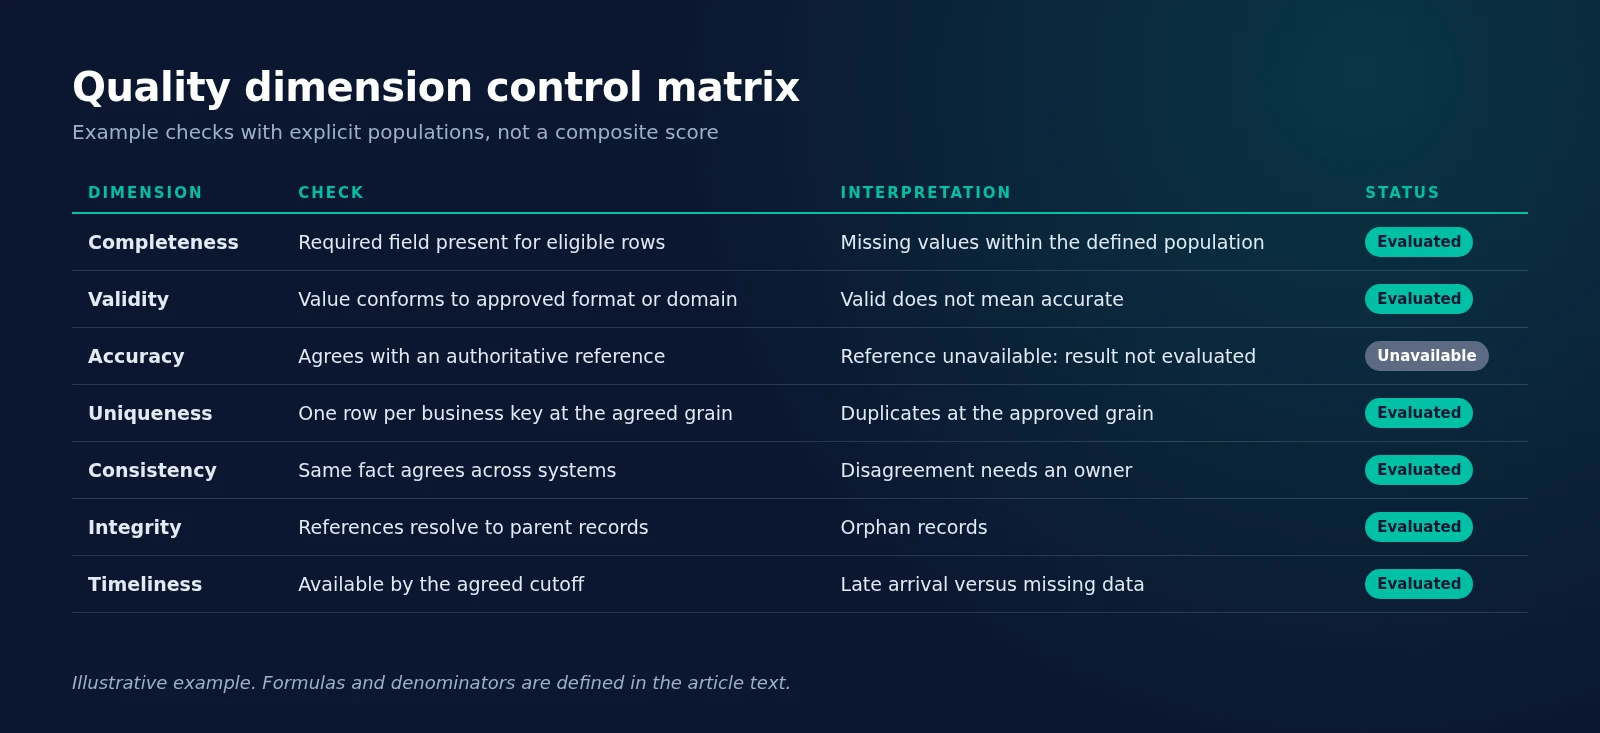
A dimension becomes actionable when a rule states the eligible population, expected condition, denominator and consequence of failure. Use the following fictional examples to design controls. These are test specifications, not measured customer outcomes or universal thresholds.
| Dimension | Illustrative check and denominator | Failure and consequence |
|---|---|---|
| Accuracy | Verified settlement amounts matching an approved reference divided by amounts independently verified | An incorrect amount can misstate the settlement obligation |
| Completeness | Completed orders with a customer identifier divided by all completed orders in scope | A missing identifier can prevent customer-level reconciliation |
| Consistency | Mapped customer classifications agreeing between two named snapshots divided by eligible mapped comparisons | A disagreement can change segmentation across reports |
| Timeliness | Required daily deliveries received by the approved deadline divided by deliveries expected | A late load can leave a decision using an incomplete period |
| Validity | Evaluated non-null currency codes in the approved code set divided by evaluated non-null codes | An unsupported code can disrupt conversion; nulls require a separate rule |
| Uniqueness | Distinct non-null order_id and line_id pairs divided by non-null key-bearing rows | A repeated line key can inflate revenue or volume |
| Integrity | Eligible order customer references found in the approved customer snapshot divided by references checked | An unmatched reference can break a required business relationship |
Integrity is listed separately here because it supports a useful relationship control. The six-dimension framework in the preceding sections remains valid. State how your organization groups the checks rather than presenting seven as a universal standard.
Keep the result attached to its measurement definition
Suppose 200 completed order lines require a customer identifier. Ten identifiers are missing, so completeness for that requirement is 190 divided by 200, or 95 percent. Now suppose two rows share a non-null order-line key, with all other non-null keys distinct. A distinct-key metric and a metric counting rows that occur exactly once will report different uniqueness values. Record which formula is used before comparing tools or reporting improvement.
Keep rule failures separate from execution failures. If a reference connection is unavailable, the integrity check has no established result for that run. Do not label it passed or assign a fabricated zero score. Record the unavailable reference and the rerun required. Where a business owner accepts an exception, retain the original finding and the approval rather than changing the measured data to hide it.
Assign a business owner, review frequency and evidence location to each material control. A severe failure in a critical settlement identifier should remain visible even if many low-risk descriptive fields score well. A weighted overall score can summarize a defined scope, but it cannot replace the underlying rule results and exceptions.
Use continuous assessment and controls with DataTrust to evaluate execution and reconciliation against your requirements. Use profiling and reusable rule context with RightSight when preparing governed definitions and reviewed checks. The ETL testing guide connects these requirements to source-to-target transformations.
Set thresholds from consequences
Classify critical elements before averaging results. A high completeness score across optional attributes should not conceal missing settlement identifiers. Define the threshold, severity, owner, exception process, and review frequency for each critical rule.
RightSight can provide profiling and reviewed rule context, while DataTrust supports validation and reconciliation requirements. Confirm the implemented formula and population in the relevant workflow rather than assuming every displayed score measures the same thing.
Continue with quality rule examples to turn dimensions into test specifications.
Frequently asked questions
Are there six or seven data quality dimensions
Six dimensions are commonly used, but frameworks vary. Integrity is sometimes treated separately. State the chosen framework and measurement definitions rather than presenting one count as universal.
Can a complete field still be wrong
Yes. A value can be present, correctly formatted, and inaccurate. Accuracy requires evidence that the value reflects the intended fact.
Should every dimension have the same threshold
No. Thresholds should reflect business consequences, criticality, and approved exceptions. A critical identifier may need a stricter requirement than an optional descriptive attribute.
What denominator should a data quality score use
Use the population eligible for the specific rule and state it explicitly. Required values, key-bearing rows, mapped comparisons, expected deliveries and independently verified values are different populations. Record exclusions, null handling and missing-reference behavior with the formula.
Should a quality check pass when its reference data is unavailable
No established result exists when required reference evidence cannot be accessed. Record the check as not evaluated or failed to execute under the chosen operating convention, investigate the cause and rerun it. Keep that state distinct from a rule that executed and found a data defect.
Request a Demo to review how your critical data requirements can become measurable controls.