Augmented Data Quality, Observability & Pipeline Monitoring: Why the Three Must Work as One
The complete analysis behind the April 2026 DataPulse newsletter: the financial cost of silent failures, how each capability works mechanically, the five dimensions of data observability, the shift from reactive to predictive monitoring, a five-level maturity model, industry-specific failure patterns, and the implementation sequence and business case that consistently gets investment approved.
The Core Problem
What the opening scenario in the newsletter is really illustrating
Pipeline monitoring was built to answer one question: did the job finish? In 2026, the question that matters is different: was the data right when it did? These are not the same questions. Conflating them is what produces the consistent pattern - organisations that invest heavily in AI but cannot scale it, because the data underneath the models is not reliably what it appears to be.
A pipeline runs clean. No errors logged. The dashboard refreshes on schedule. Three days earlier, a source system silently changed a field type. The reconciliation job absorbed the mismatch without raising a flag. By the time an analyst spots the variance - in a board presentation - that corrupted data has already fed two AI models and five downstream reports. Nothing technically failed. The job completed. The data arrived. The problem was with what the data said.
Job health and data health are different properties, monitored by different methods, with different consequences when they fail. Most enterprise monitoring covers the first. Most AI failures trace back to the second.
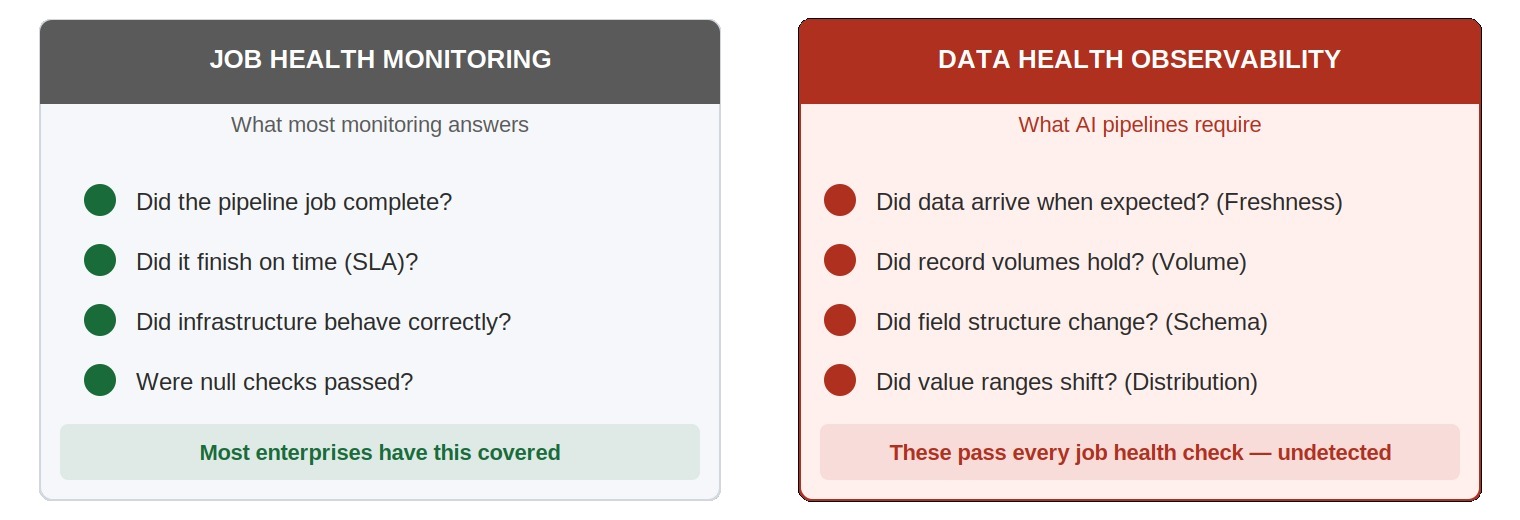
Infographic 1: Job health monitoring answers whether the job ran. Data health observability answers whether what arrived was actually right.
The gap between these two questions is not a configuration problem. It is a structural limitation of what monitoring was designed to watch. Data observability, augmented data quality, and pipeline monitoring together close this gap - but only when implemented as a coordinated layer, not three separate tools serving three separate teams with no shared visibility.
"AI-ready data depends on three key pillars: metadata management, data quality, and data observability. Without these foundations, more than 60% of AI projects will fail to deliver on business goals." - Gartner, 2026
The Financial Reality
The cost most organisations are not measuring is larger than the one they are
Data quality failures share an unusual property: their cost almost never appears at the point of origin. The cost surfaces weeks later - in a customer refund, a wrong forecast, a regulatory finding, a delayed product launch, or a six-month model retrain. By then, the connection to the original data problem is rarely made explicitly.
- Gartner research puts the average annual cost of poor data quality at $12.9 million per organisation across all industries. For financial services and healthcare, the figure is consistently higher.
- MIT Sloan Management Review research finds organisations lose 15–25% of revenue annually to poor data quality - through wasted operational effort, inaccurate decisions, and missed opportunities.
- 43% of chief operations officers rank data quality as their most significant data priority - ahead of data security, integration, and AI governance (IBM IBV, 2025).
- Data scientists and engineers spend 60–80% of their time cleaning and validating data in organisations without mature quality infrastructure - not building models or generating insights.
Research consistently finds 85% of data quality issues are discovered downstream - after the data has already been used. The average time between a quality failure occurring and being detected is days to weeks. In AI pipelines running continuously, that window means potentially thousands of compounding wrong outputs before the failure becomes visible. The cost increases by roughly 10x for every stage a failure progresses through the pipeline before being caught.
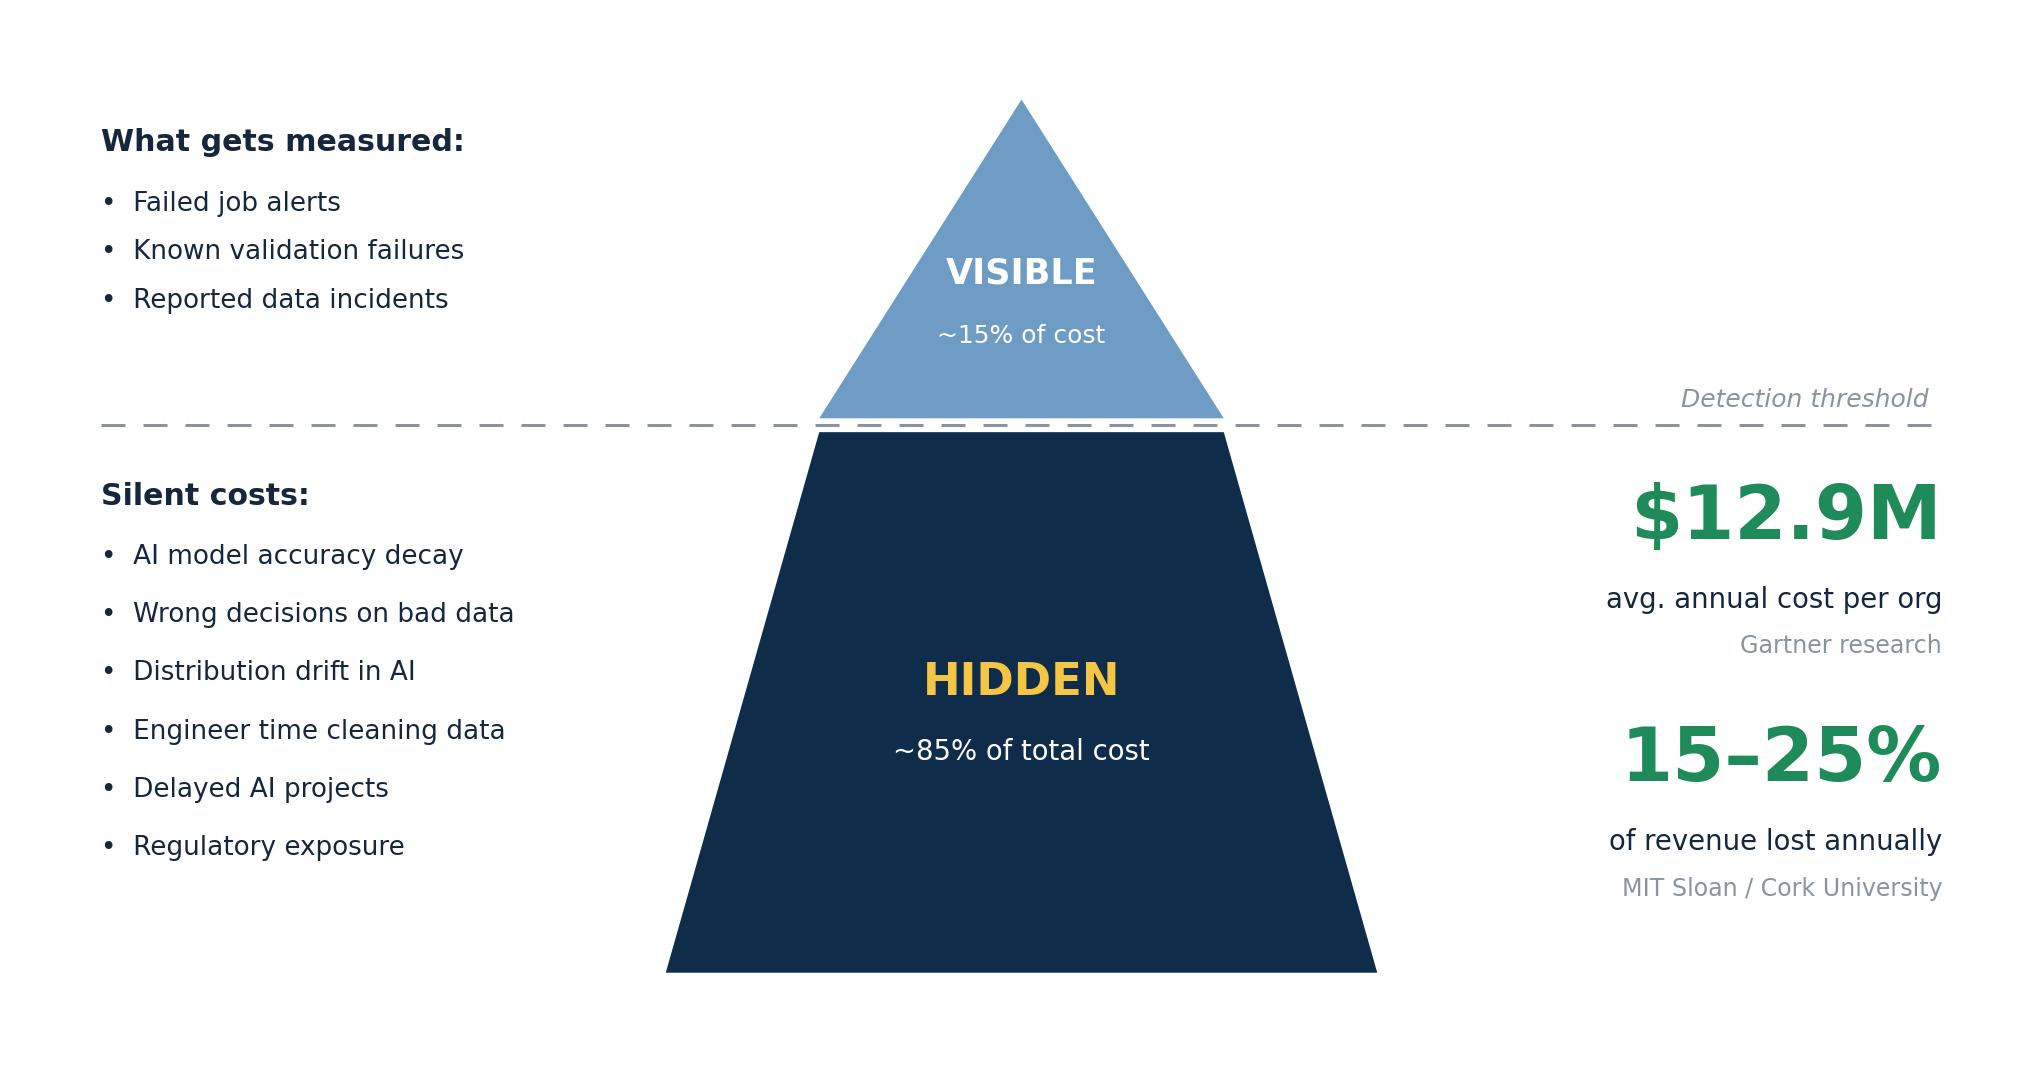
Infographic 2: The Data Quality Cost Iceberg - 85% of cost is hidden, appearing downstream, disconnected from its origin.
The Three Capabilities
Why augmented data quality, data observability, and pipeline monitoring must work as one layer
Each capability catches a specific class of failures that the others structurally cannot see. A gap in any one of them means the other two cannot compensate.
Gartner's 2026 MQ for Augmented Data Quality Solutions formalised the market's recognition of this convergence by making alerts and visualisation a standalone mandatory capability for the first time - meaning quality platforms must now surface operational monitoring signals, not just produce batch violation reports. The renaming of the "AI/ML Development" use case to "Analytics and AI readiness," with explicit coverage of monitoring production AI pipelines, signals the same shift: data quality is now a production operations responsibility.
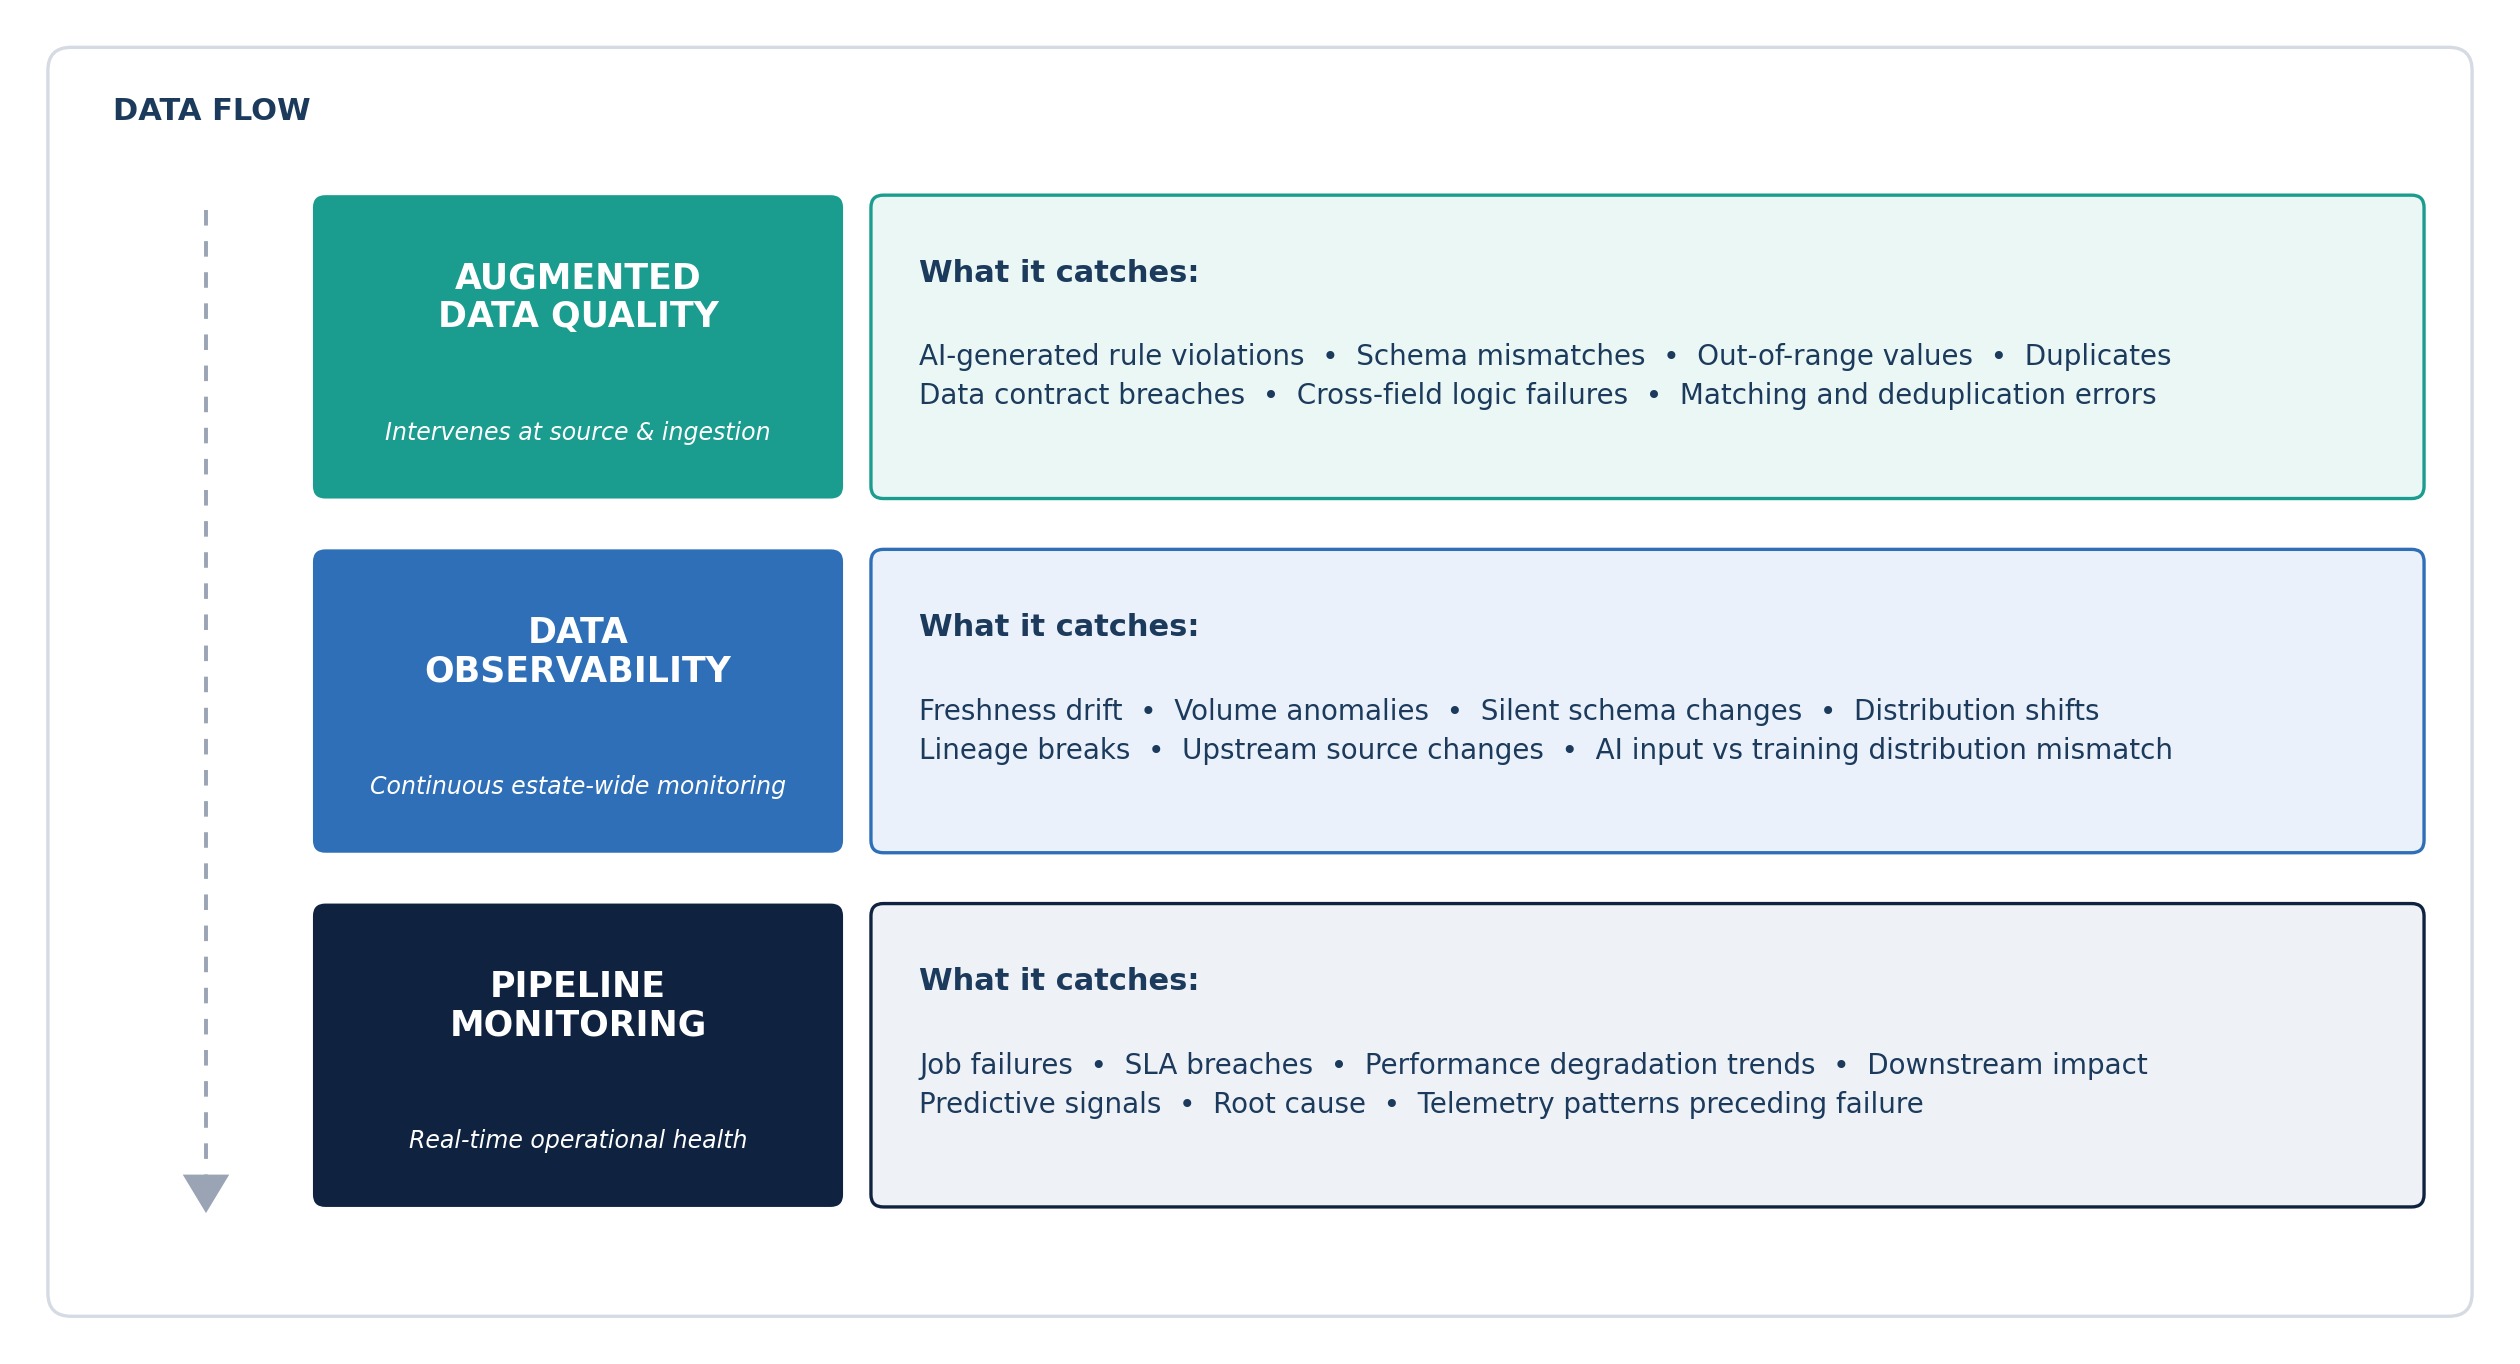
Infographic 3: The Three-Layer Data Reliability Architecture - each layer catches what the others cannot.
Augmented Data Quality
How it actually works - and what it replaces
Traditional data quality management has three structural weaknesses that become critical at AI scale:
- Coverage is always partial - engineering teams author rules for assets they know best. AI-feeding pipelines are often newer, more specialised, and thinner on coverage.
- Rules go stale - static rules detect only what they were written to detect, not that what "normal" looks like has changed.
- Scheduled validation is too slow - when a quality check runs every four hours and an AI inference pipeline runs every fifteen minutes, there is a permanent exposure window.
How AI-driven profiling and rule generation addresses all three
Augmented data quality replaces human rule authoring with AI-driven rule generation. The platform profiles each monitored asset, learns the statistical baseline for every field, and generates validation rules from that learned history. Rules update when patterns legitimately change. Coverage is comprehensive by default. The engineer's role shifts from writing tests to governing test coverage.
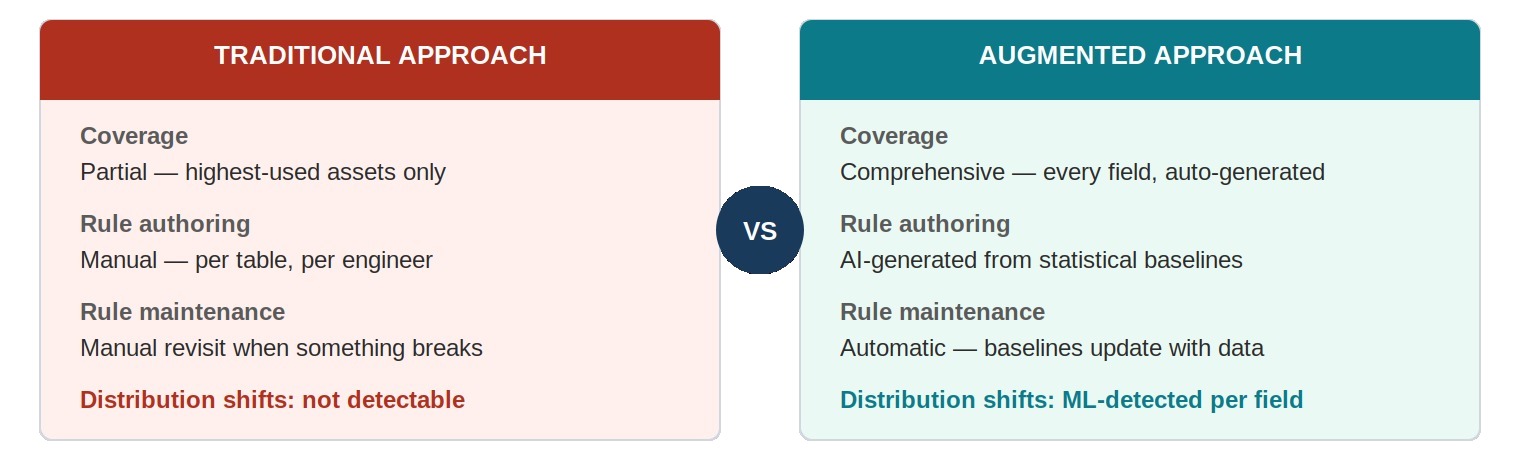
Infographic 4: Traditional vs Augmented Data Quality - coverage, rule authoring, maintenance, and distribution detection compared.
Data contracts at domain boundaries
A complementary pattern now standard in mature data estates is data contracts at every point where data crosses between team ownership. A data contract is a machine-readable agreement specifying schema, refresh cadence, quality thresholds, and SLA commitments. When the producing team violates the contract, the pipeline fails at the boundary - the consuming team is protected, the failure is contained to its origin, and root cause is immediate rather than discovered through a cross-team investigation days later.
Data Observability
The five dimensions - and why monitoring only two leaves the most consequential failures invisible
Data observability watches whether data behaves as expected - including in ways that no rule was written to catch. A field that passes every quality rule - null check, type check, range check - while its average value shifts from 450 to 90 over three days violates no rule. But an AI model trained on data averaging 450 will degrade significantly on data averaging 90. Observability catches this. Rule-based monitoring does not.
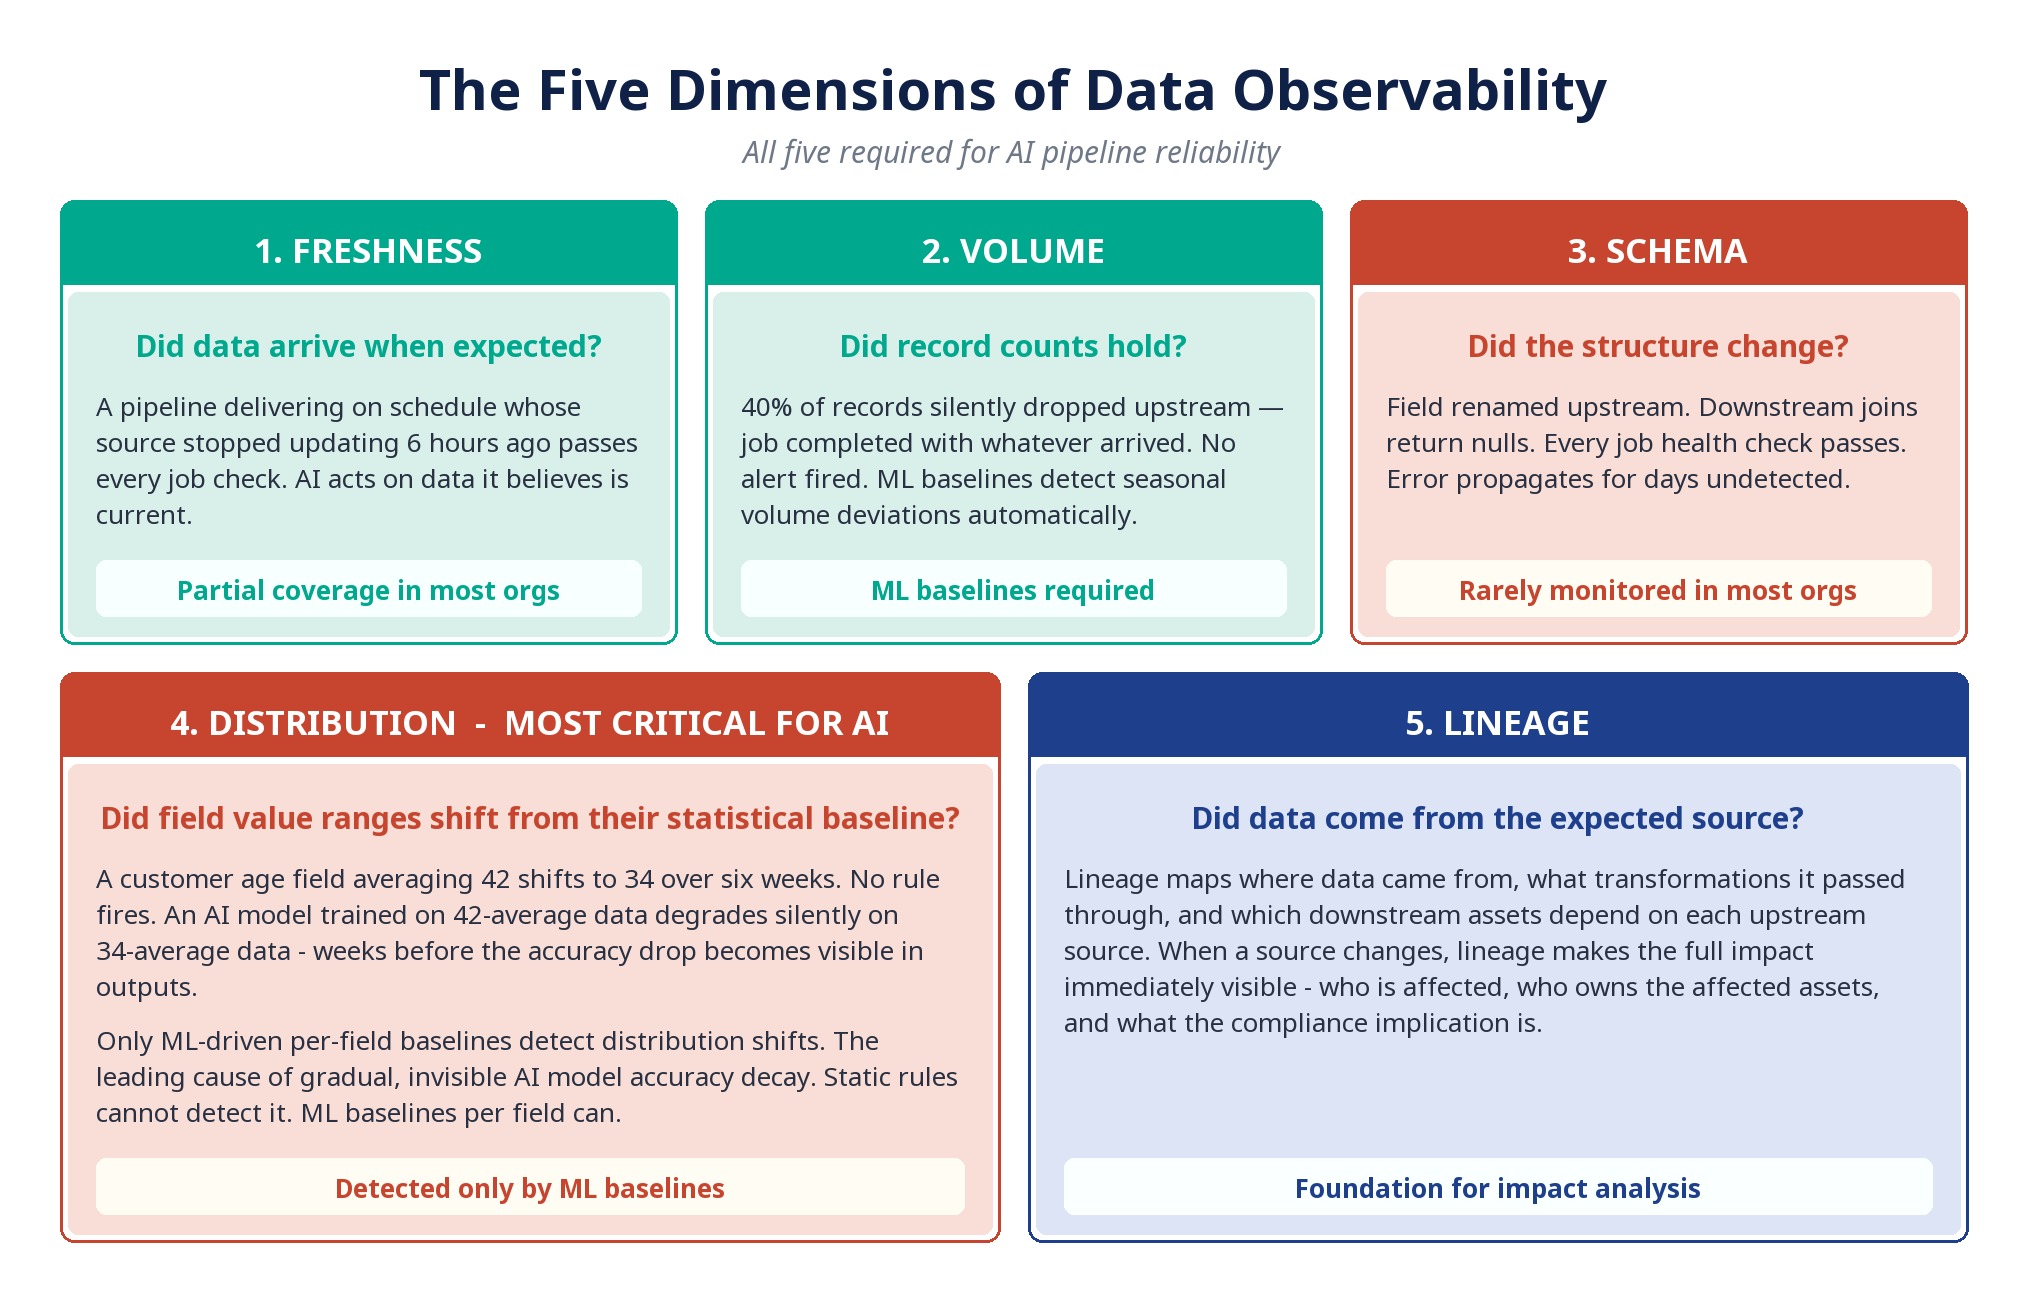
Infographic 5: The Five Dimensions of Data Observability - all five are required for AI pipeline reliability.
1. Freshness - did the data arrive when expected?
A pipeline delivering on schedule whose source data stopped updating six hours ago passes every job health check. Its freshness failure is invisible to infrastructure monitoring. AI models acting on stale data believe they are working with current information when they are not.
2. Volume - did expected record counts hold?
A pipeline delivering 40% fewer rows than expected completed successfully - it processed all the records it received. The missing records only become detectable if you know what the volume should have been. ML-driven volume baselines learn seasonal and business-cycle patterns, flagging deviations from expected behaviour rather than from static thresholds.
3. Schema - did the structure change?
Schema changes are among the most common sources of silent pipeline failures and the least monitored. When a source system renames a column or changes a data type, downstream systems that depended on the previous schema are at risk - and most will silently consume wrong data rather than fail loudly.
4. Distribution - did field value ranges shift? (Most critical for AI)
Distribution shifts are the signature of the failures that degrade AI models gradually and silently. A customer age field whose mean shifts over six weeks. A transaction distribution whose tail expands. None of these are caught by null checks or range rules. All are detected by ML-driven distribution monitoring.
5. Lineage - did data come from the expected source?
Lineage tracks the provenance of data - where it came from, what transformations it passed through, and how it relates to downstream assets. When a source system changes or a join condition shifts, lineage makes the full impact immediately visible. Lineage is also the foundation of compliance evidence for EU AI Act Article 10 requirements.
Pipeline Monitoring
The shift from reactive alerting to predictive operations
The standard model is reactive: a job fails, an alert fires, an engineer investigates. The alert tells you the job failed. It does not tell you which downstream assets were affected, whether the failure was data-related or infrastructure-related, what changed upstream that caused it, or whether the same pattern has appeared before under similar conditions.
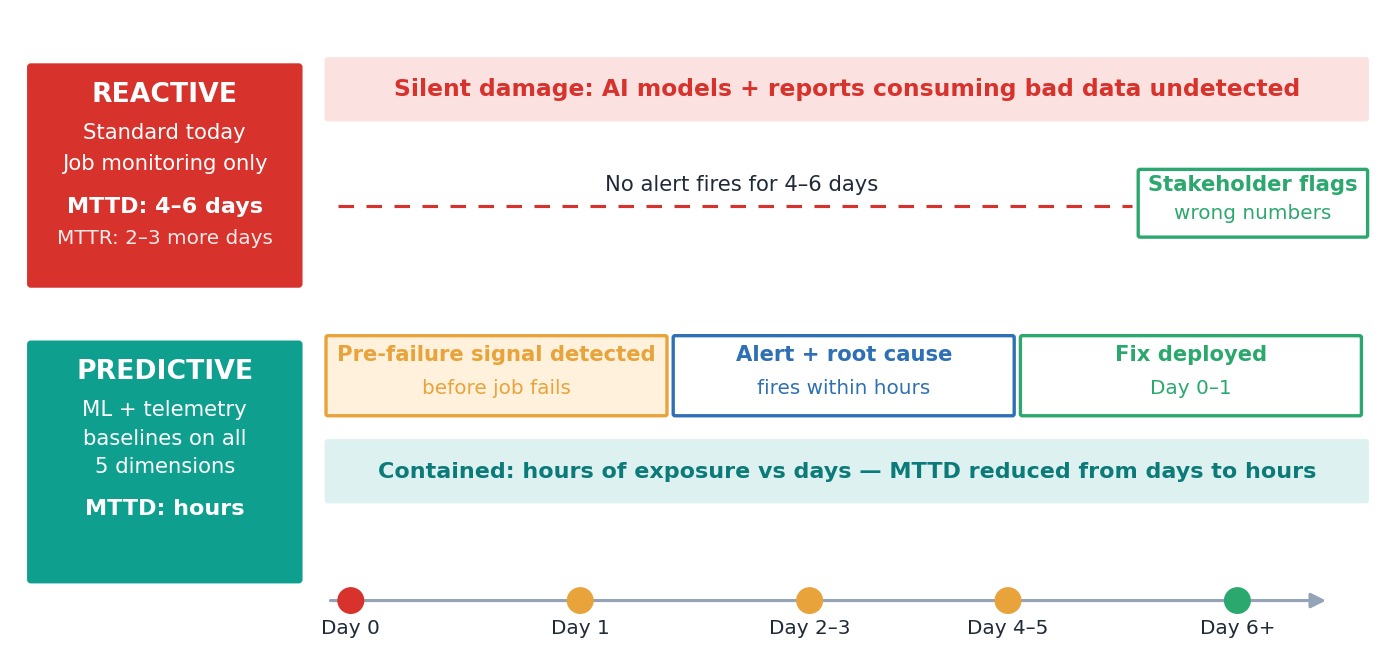
Infographic 6: Reactive vs Predictive Pipeline Monitoring - the same failure, two different outcomes and MTTD profiles.
Predictive pipeline monitoring treats telemetry as data. Job duration, row counts, validation pass rates, SLA adherence, resource consumption, upstream dependency health - collected continuously, stored, and modelled over time. The patterns that precede failures include:
- Job duration increasing incrementally across successive runs - indicating growing data volumes that will eventually breach SLA thresholds before any threshold alert fires.
- Validation pass rates declining gradually on a specific field - indicating upstream data degradation that is not yet causing job failures but will propagate to downstream quality if unaddressed.
- Upstream source query times increasing - indicating source system performance degradation that will cascade to consuming pipelines within hours.
For predictive monitoring to work, pipelines must be designed to expose structured telemetry from the start. Pipelines built for observability treat job duration, row counts by table and partition, validation pass rates by rule and field, SLA adherence, and dependency resolution times as explicit structured outputs alongside the data they produce.
Maturity Model
Where most organisations actually sit - across all three capabilities
The 2025 DATAVERSITY Trends in Data Management Survey provides the baseline: only 15% of organisations report mature data governance, only 11% have high metadata management maturity, and only 4% have high maturity in both data governance and AI governance simultaneously.
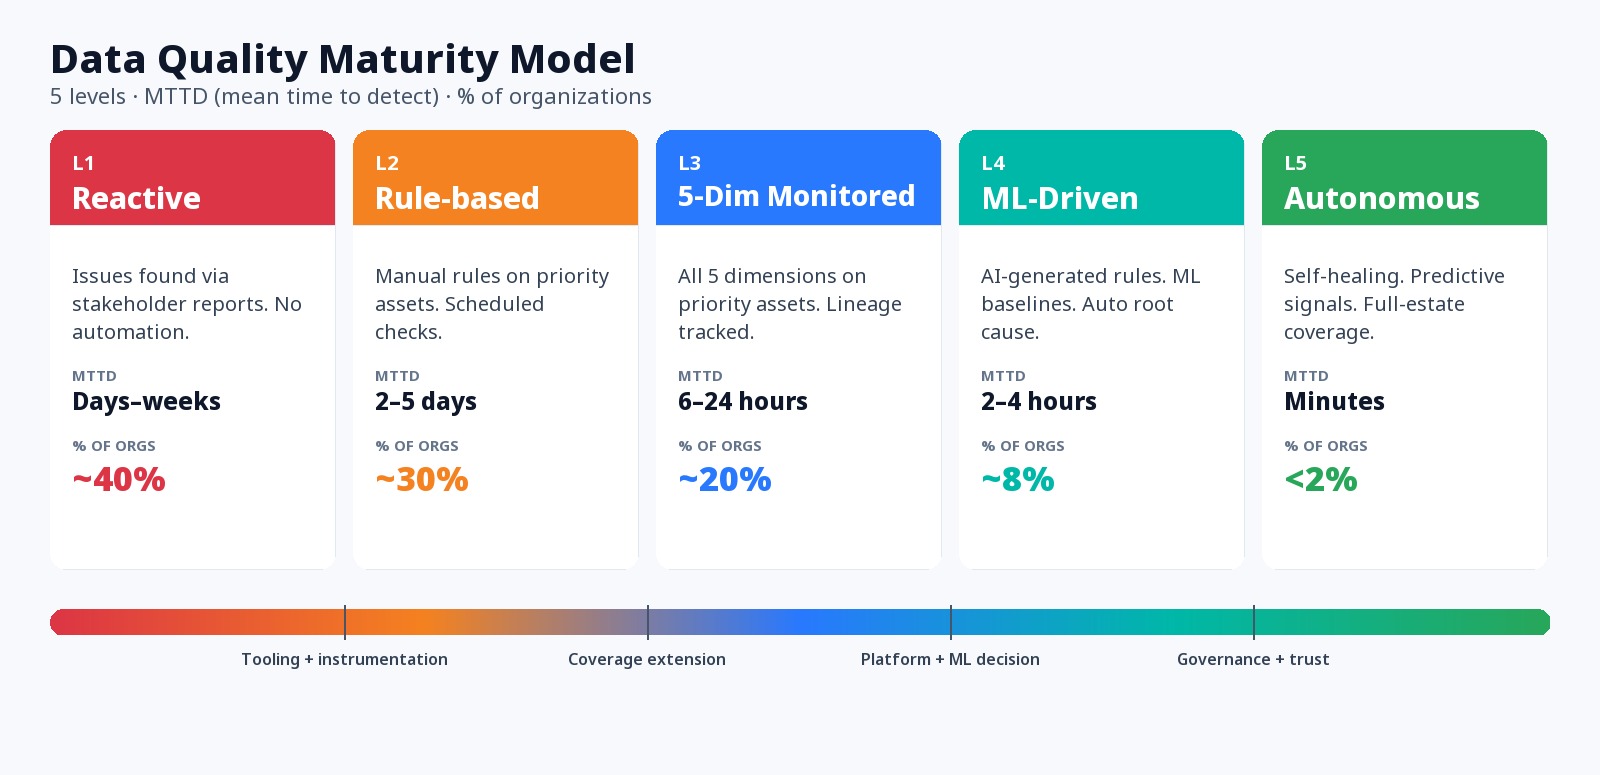
Infographic 7: Data Quality, Observability & Pipeline Monitoring Maturity Model - five levels with MTTD benchmarks and approximate market distribution.
The most common maturity transition mistake: Organisations attempting to move from Level 2 to Level 4 in a single programme consistently underperform relative to those that instrument one or two high-risk pipelines first, demonstrate measurable MTTD and MTTR improvement, and use that evidence to build the internal case for broader rollout. The technology transition is rarely the bottleneck. Building internal confidence in automated quality decisions is - and that confidence is earned through demonstrated performance on problems the organisation already knows are costly.
The Leadership Perspective
What changes when CDOs and CIOs treat data quality as a production reliability function
IBM's 2026 IBV CDO Study found only 26% of CDOs confident their data can support AI-enabled revenue streams - despite 81% reporting their data strategy is integrated with their technology roadmap. The 55-point gap between stated strategy and actual confidence reflects organisations where the board slide deck says "data-driven" and the engineering team's daily experience says "we spend most of our time validating data before we can use it."
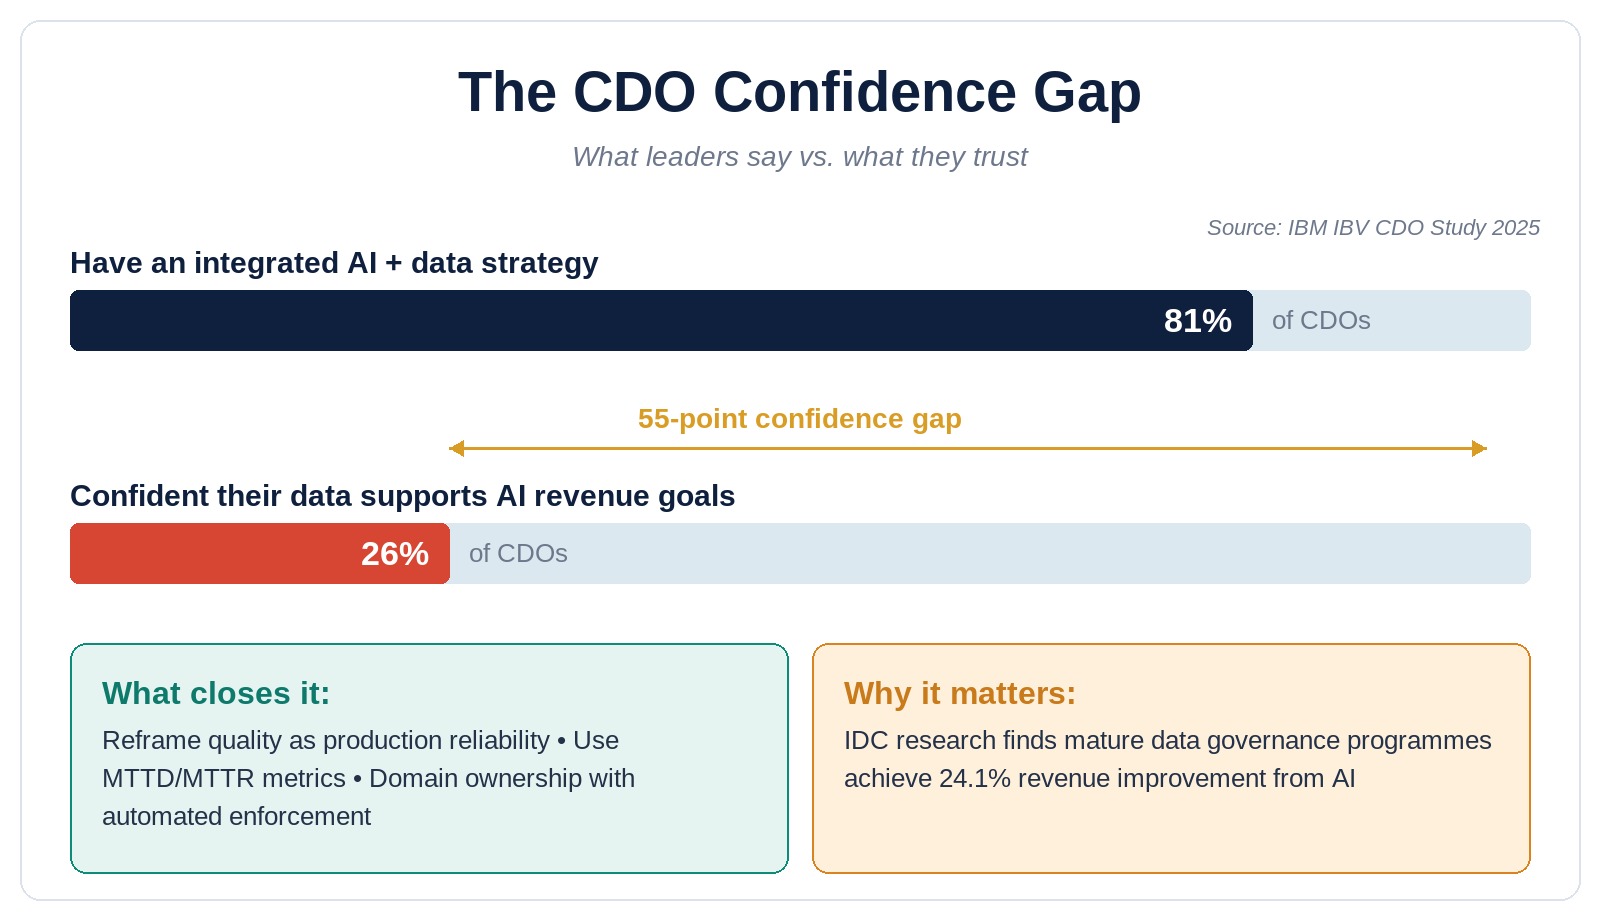
Infographic 8: The CDO Confidence Gap - 81% have an integrated strategy, only 26% are confident their data supports AI revenue streams.
The metric shift that changes the leadership conversation is from data quality scores to operational reliability metrics. Mean Time to Detect and Mean Time to Resolve are metrics leadership already tracks for infrastructure availability. When a CDO presents data investment in MTTD and MTTR terms - with before-and-after numbers from a pilot cohort of pipelines - the conversation changes from "why should we invest in data quality?" to "what do we need to extend this?"
"Organisations with mature data governance programmes achieve 24.1% revenue improvement and 25.4% improvement in cost savings from AI. The gap between those organisations and the rest is not model sophistication. It is data infrastructure maturity." - IDC, cited in DATAVERSITY, 2026
Forrester's Q3 2025 Wave on Data Governance Solutions found that federated domain ownership with automated enforcement shows the highest quality adherence. Central teams set standards and operate tooling. Domain teams own quality for their assets.
The Engineering Perspective
Three architectural patterns separating data estates that catch problems early
Pattern 1: Domain-owned, AI-generated quality coverage with data contracts at every boundary
AI-driven profiling generates rule candidates from the statistical history of each field. Domain teams review and approve generated rules in their context - applying domain knowledge that no automation can infer. Engineers govern overall coverage and resolve edge cases. Data contracts at every cross-domain boundary complement this. Schema violations fail at the boundary - the consuming team is protected, the failure is contained, and attribution is immediate.
Pattern 2: Five-dimension observability, continuously, at column granularity
The practical starting point is the ten to twenty assets with highest downstream consumption and highest cost of failure - those feeding AI models, financial reporting, and regulatory submissions. Distribution monitoring at the column level with individual ML baselines per field catches the specific shifts that degrade specific AI models independently of what is happening in other fields of the same table.
Pattern 3: Structured telemetry as a first-class pipeline output from design time
Pipelines that cannot be monitored predictively share one characteristic: telemetry is implicit rather than explicit. Organisations that have made this transition consistently report 20–30% MTTR improvements independent of the monitoring tool deployed - because instrumented pipelines are dramatically easier to debug.
What Agentic AI Changes
Why autonomous AI systems make data observability a non-negotiable architectural requirement
When AI systems produced reports and dashboards, a quality failure meant a wrong number that a human reviewed. The feedback loop was slow but it existed. When AI agents take autonomous actions - updating records, routing transactions, adjusting pricing - the same failure propagates at machine speed across thousands of instances before the feedback loop completes.
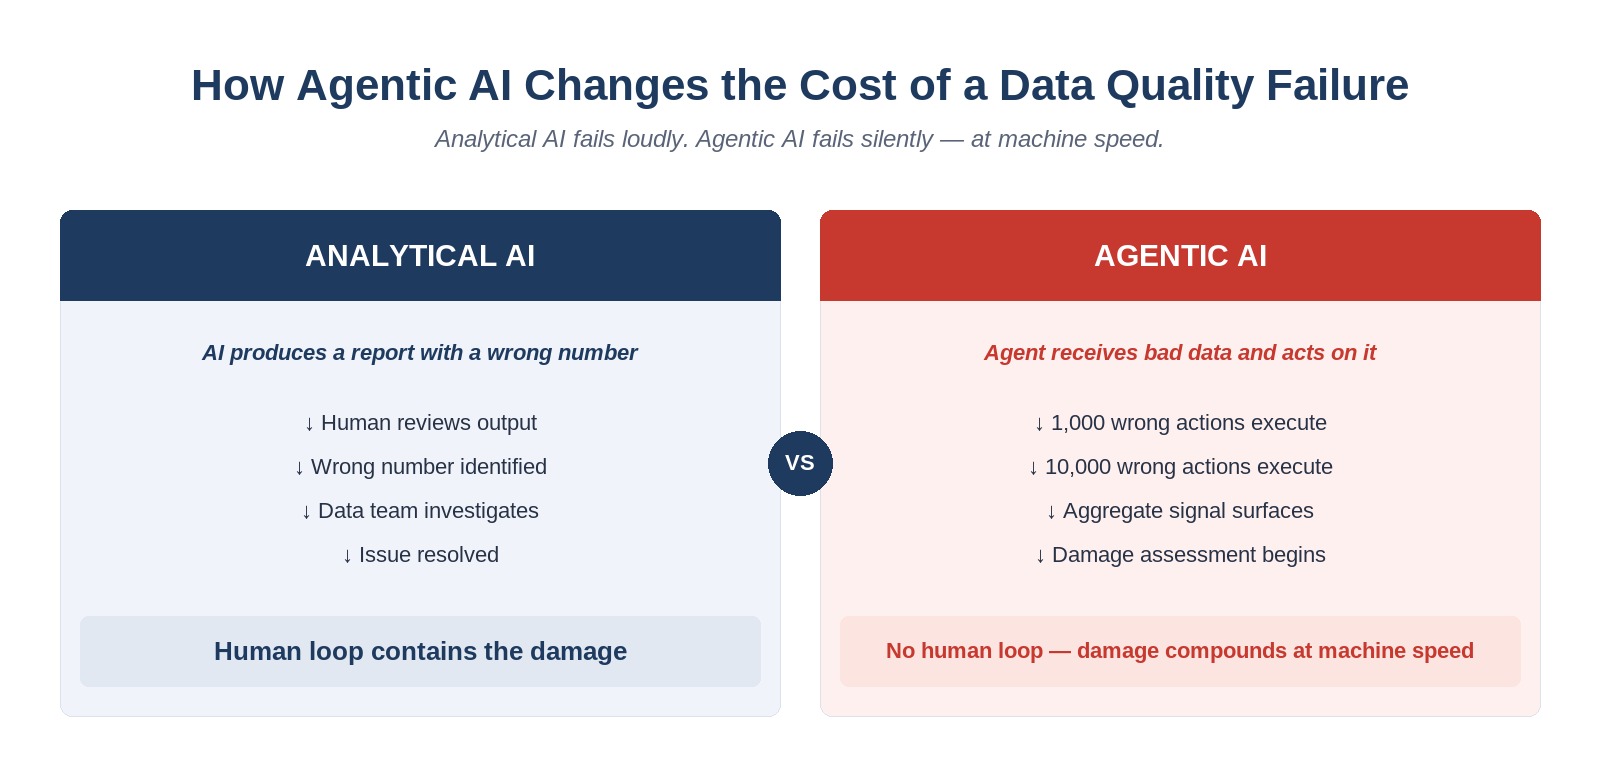
Infographic 9: How Agentic AI Changes the Cost of a Data Quality Failure - analytical AI vs agentic AI consequences compared.
Gartner's March 2026 D&A predictions quantify the forward exposure: by 2030, 50% of AI agent deployment failures will be attributed to insufficient data governance and runtime enforcement - not model quality, not infrastructure. Data.
Three requirements distinguish governance infrastructures that can support agentic AI from those that cannot:
- Runtime policy enforcement: Data access policies and quality thresholds enforced automatically at the point of consumption by the agent, not reviewed after the fact.
- Continuous input monitoring: Data consumed by each AI agent monitored for freshness, schema consistency, and distribution alignment with training data.
- Full action auditability: Every agent action traceable to the data that informed it, the model version, and the quality state of the input at the time - required by the EU AI Act for high-risk AI systems.
Industry Dimensions
How the same problem manifests differently across sectors
Financial services: Operate under data quality obligations that predate AI - BCBS 239, Solvency II, IFRS 17, DORA. The EU AI Act adds AI-specific obligations on top - Article 10 mandates proof of data quality for training sets in high-risk AI systems, with non-compliance fines reaching €35 million. SAP ERP environments move data through complex transformation chains where field-level discrepancies accumulate invisibly. Field-level automated reconciliation catches the discrepancies that row-count checks miss.
Healthcare: A significant proportion of clinically relevant data is unstructured - clinical notes, imaging metadata, pathology reports - and traditional quality monitoring tools were built for structured data. The patient safety dimension creates urgency beyond revenue loss or regulatory fines: an AI model making diagnostic support recommendations on degraded training data is not a business continuity risk. It is a patient safety risk.
Manufacturing: The data quality challenge is primarily velocity and sensor reliability. A sensor reading 5% below its calibrated baseline for twelve hours has produced twelve hours of corrupted production data before the drift is detectable through traditional monitoring.
What Goes Wrong
Five failure patterns that consistently set programmes back
Building the Internal Case
The four framing decisions that determine whether the budget case gets approved
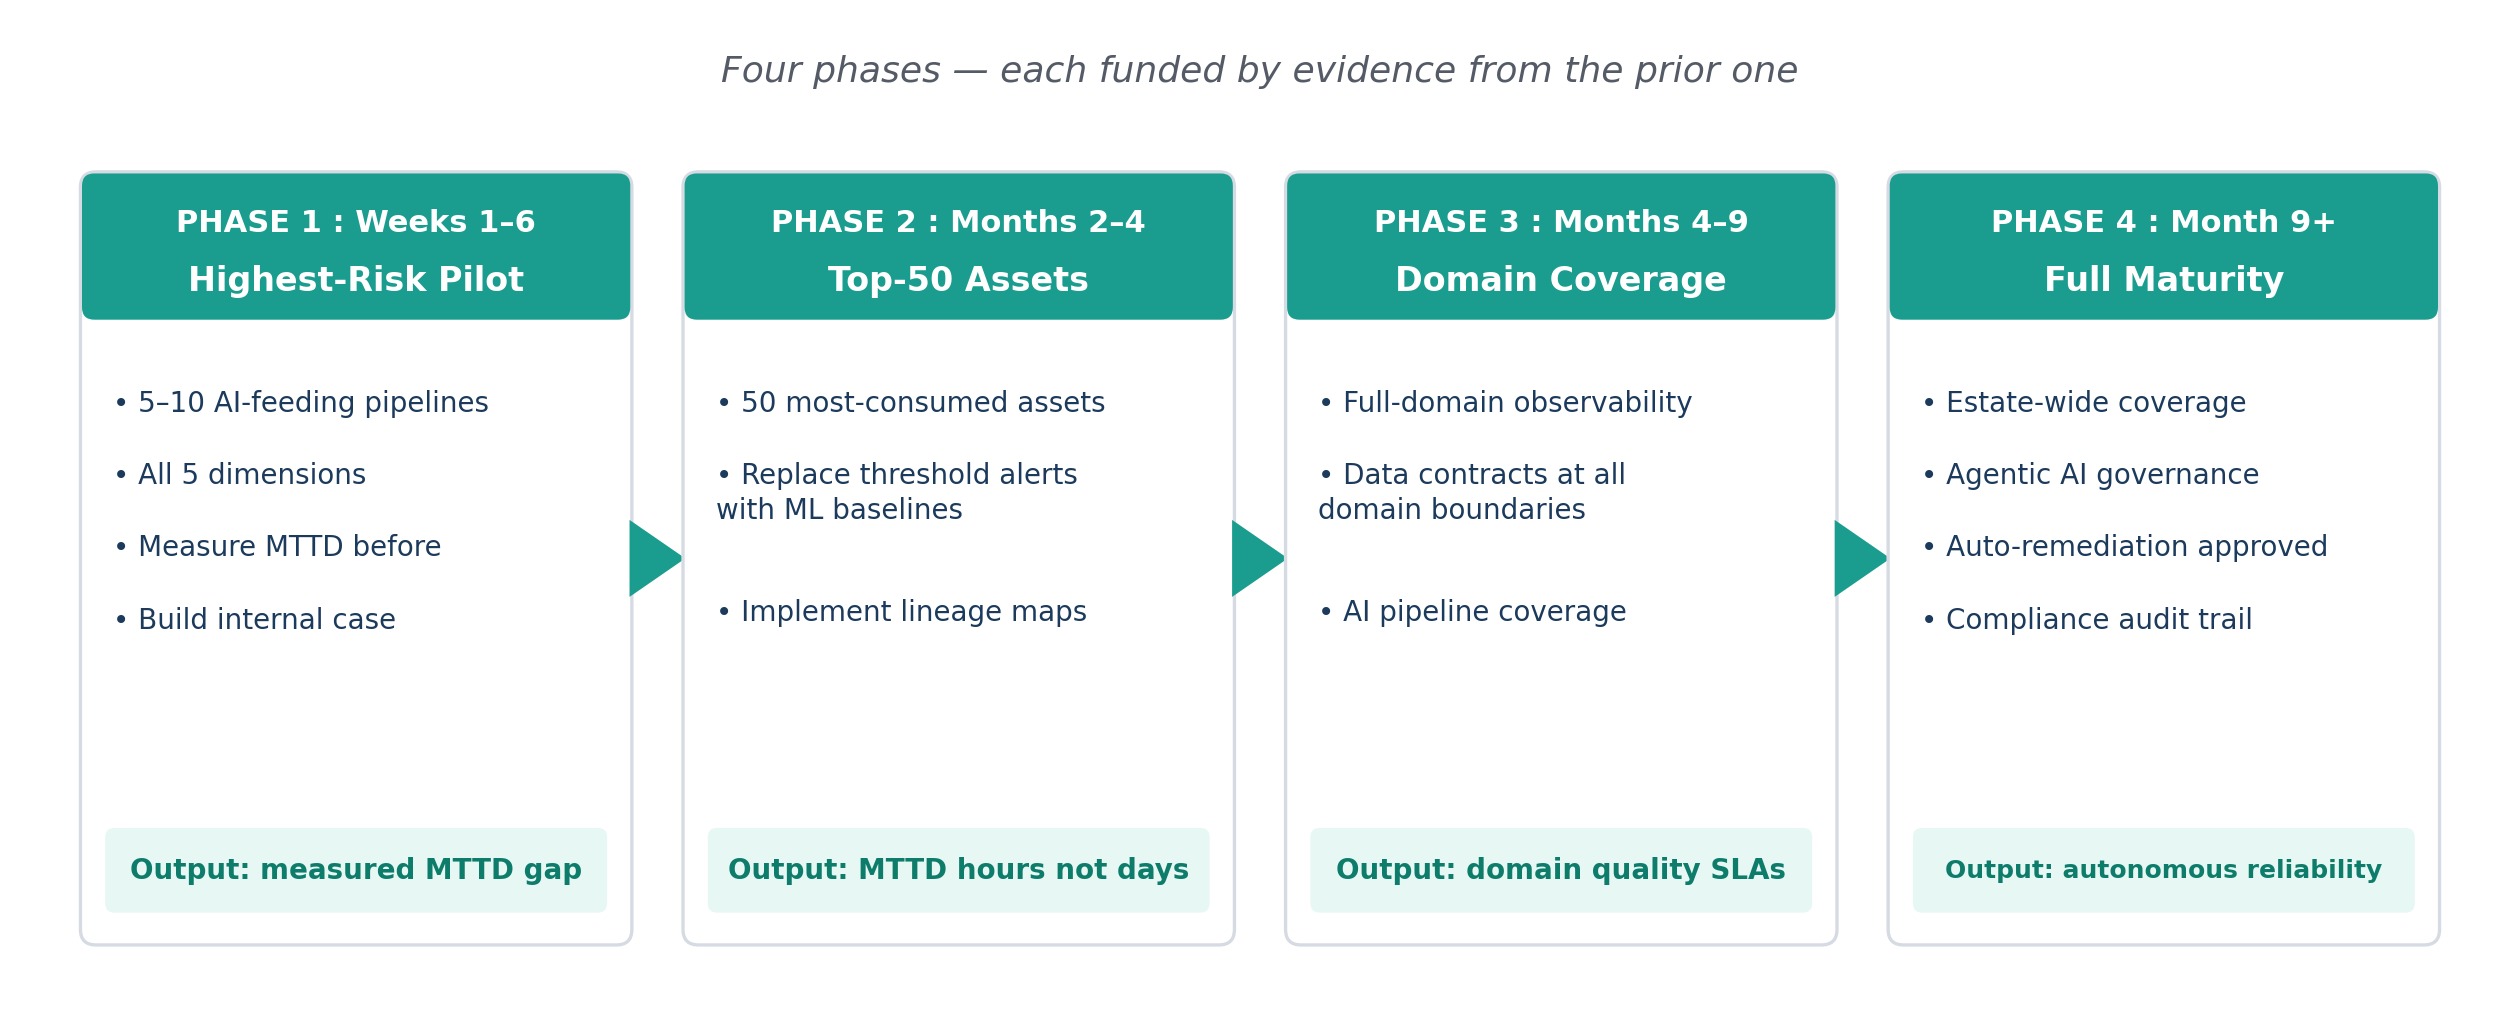
Infographic 10: The Implementation Sequence That Works - four phases, each funded by evidence from the prior one.
Bottom Line
The dashboard looked fine. That was the problem.
Augmented data quality, data observability, and pipeline monitoring together add a different kind of visibility - one that watches what the data says, not just whether the job completed. In a world where AI systems act on data continuously, at machine speed, without human review at each decision point, that distinction determines whether the AI estate is a reliable operational asset or a liability that compounds its own errors.
The organisations successfully scaling AI in 2026 are not the ones with the most sophisticated models. They are the ones that built the infrastructure to know, in real time, whether the data underneath those models is trustworthy.
What to Watch in Q2 2026
- EU AI Act Article 10 enforcement: High-risk AI systems must demonstrate data quality for training sets, with fines reaching €35 million. Pipeline monitoring logs and lineage records are directly relevant compliance evidence.
- Gartner MQ evaluation criteria have shifted: The 2026 evaluation scores vendors on GenAI and agentic AI-driven automation under the Innovation criterion. Shortlists built on 2025 criteria need revisiting.
- Platform consolidation is the procurement direction: Dimensional Research's Landscape of Observability in 2026 found 51% of teams actively consolidating observability toolsets. Unified platforms covering quality, observability, and lineage in one architecture are where procurement is heading.
- ML-driven baselines are becoming the expected standard: The shift from threshold-based alerting to ML-driven anomaly detection is happening at market scale. Teams still tuning static thresholds are accumulating MTTD disadvantage as data estate complexity increases.
Stay ahead in the world of trusted data
Get insights on data quality, governance, observability, and AI-ready data - delivered straight to your inbox.
Edition Details
Edition
April 2026
Topics
Explore More Resources
Discover related content across our resource library
Get the next DataPulse edition
Subscribe for research-led briefings on data quality, observability, governance, and AI readiness.
Stay ahead in the world of trusted data
Get insights on data quality, governance, observability, and AI-ready data - delivered straight to your inbox.